Building a Project Dashboard in Kinetic Platform
Emailing back and forth is tremendously clunky and slow. Having to always request information on statuses of projects is cumbersome, inefficient and tiring. Why not make it easier for your stakeholders to quickly take a glance at your Kinetic Project progress? Even better, why not just build it in Kinetic?
The customer who requested this functionality originally pulled inspiration from Microsoft 365’s roadmap, but that doesn’t mean it can’t be customized to your specifications. They want the ability to see what was in development, what was in progress of being rolled out and what was already live.
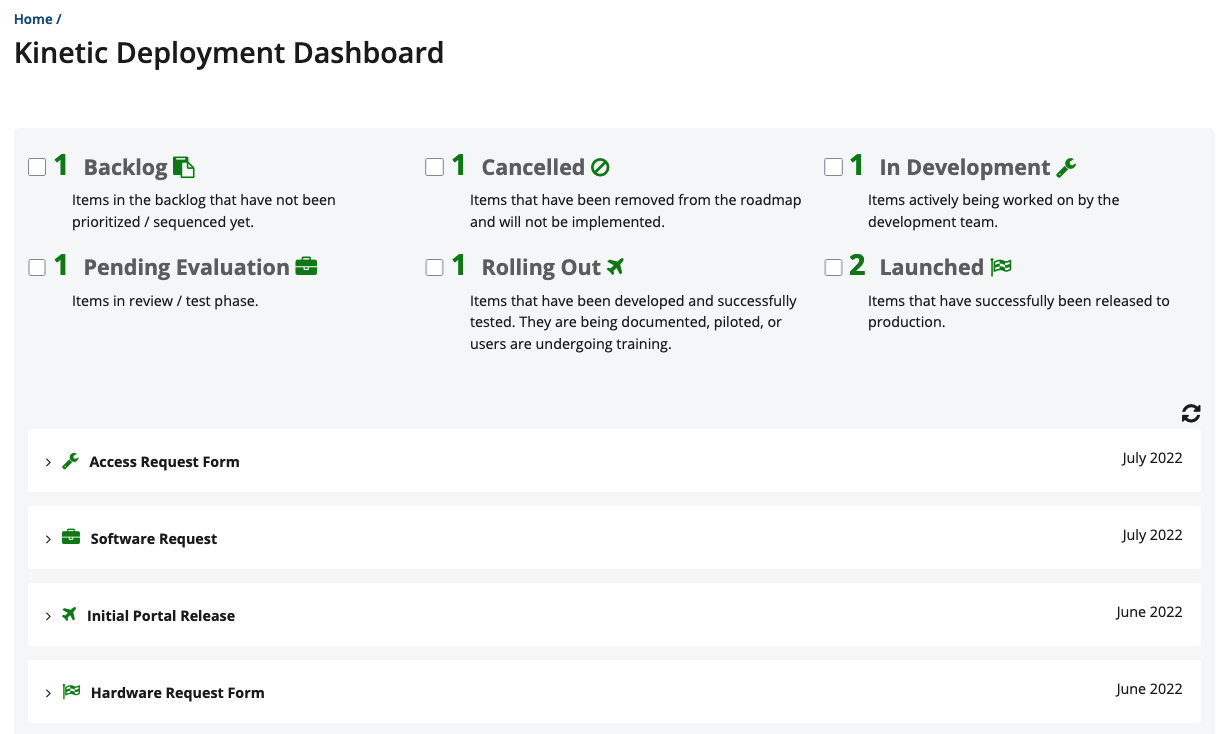
Using the Kinetic Platform, we created a presentation of datastore items. As long as the information within the datastore is kept up to date, the visual will be accurate when a stakeholder wishes to take a look at the dashboard. The hidden gem is that this can currently be done with just utilizing the form functionality within the Kinetic Platform.
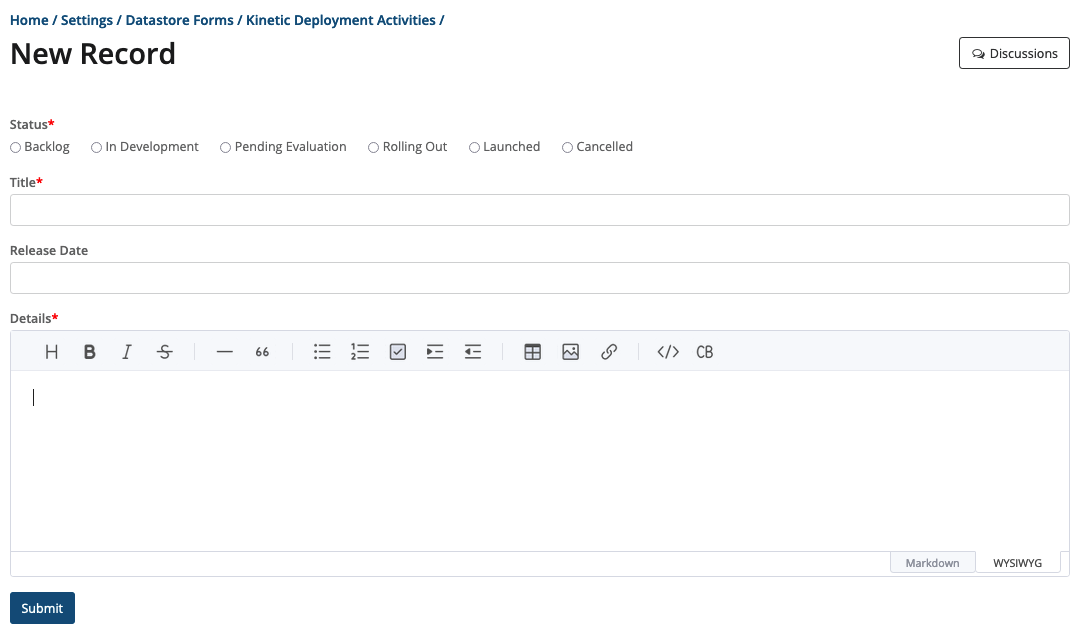
The underlying datastore form is quick and simple for this solution. You will have your status (that you want it to appear as), you will name it and a markdown editor can be used (like in this situation) that will allow you to display the details in the format that you want.
In terms of presenting this data, it is all done within a Kinetic Form. In our example, we only used one bridge for the datastore we are accessing. Then there is a script in this example for displaying the markdown functionality. Later versions of our Bundle will have that available, but we want to show everyone that there is something that can be done using a script.
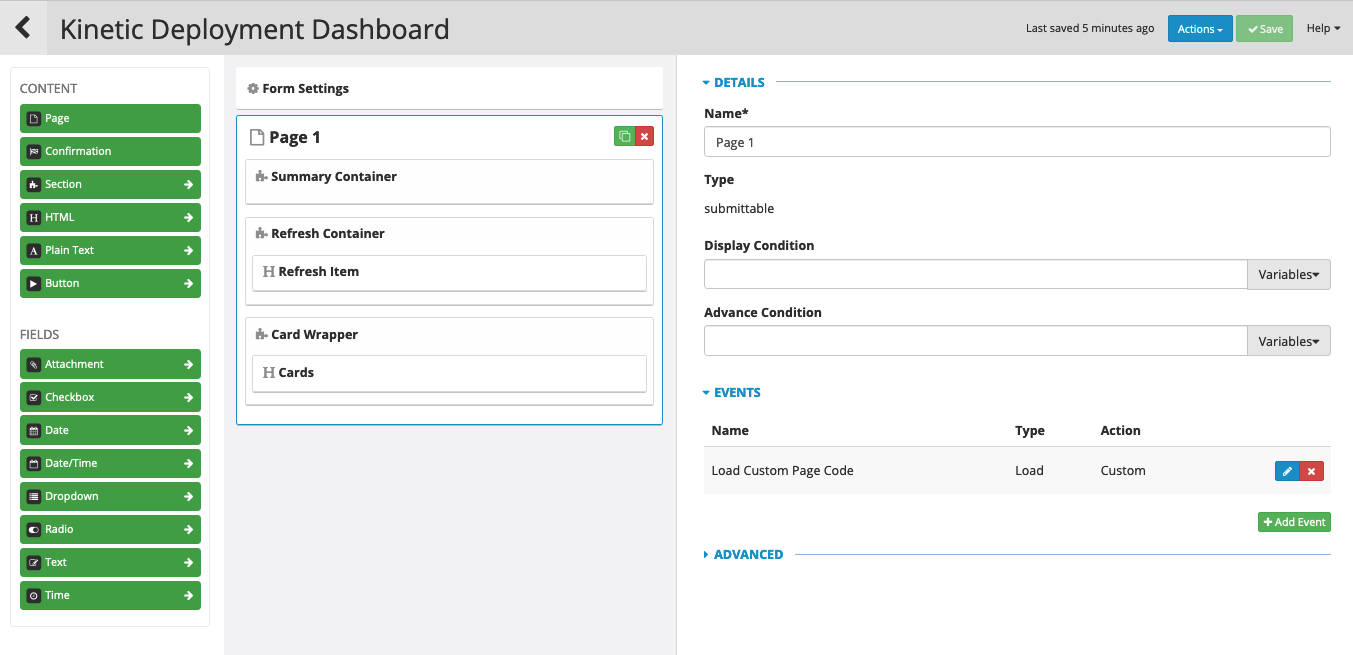
Within the form builder, we are not adding any questions. Everything is actually done through an event that is created. In this example, we have named the event “Load Custom Page Code.”
This Page Load event shows that it is relying on the Bridge to the Datastore to populate data and then categorizes them all so they can be displayed correctly.
This simple dashboard can create a big impression, especially for the busy end user that quickly needs information and does not have the time to dig into all the details. Contact us for ways you can wow your stakeholders!
Share this article